")


It’s hard to believe that Christmas has come and gone. New Year’s is right around the corner and this week I’m wrapping up our 4-part blog series over the 4 Pillars of Your Pinterest Strategy! Today we’re discussing how to review what’s working (and not working) with your strategy through analytics. I promise I won’t nerd out too much on the data! My goal is to help you understand how to access your analytics, what to look for, and how to incorporate viewing analytics into your monthly tasks.
Despite my mention of Christmas, my blog series this month has covered evergreen topics and what’s ultimately the foundation of your Pinterest strategy. Hence the name “Pillars of Your Pinterest Strategy”!
So let’s get to it this week. I’m rounding out this series with Pinterest analytics and the role they play in your overall strategy.
As I finish out the series this week, I also want to invite you to grab my FREE Pinterest strategy guide. If you’ve been devouring my content the past few weeks and you have some serious Pinterest goals set for your business in the New Year, I highly recommend getting this easy-to-follow Pinterest guide for kickstarting your marketing strategy on Pinterest!
Why We Look at Pinterest Analytics
The past few weeks we’ve covered keywords, images, and scheduling/consistency on Pinterest. Once you’ve created your keyword strategy, you’ve made your Pins, and you’re showing up consistently, it’s absolutely vital to your overall growth on Pinterest that you look at your analytics.
Analytics provide an overview of what’s working, or maybe what’s not working. They also provide you with a starting place where you’ll be able to base your growth month over month and year over year.
How Often You Should Analyze Pinterest Analytics
With Pinterest being a search engine, it takes time to index your content and categorize it, and therefore see results. For this reason, I only do a deep dive into my analytics, and my clients’ analytics, once a month.
If you look at your Pinterest analytics daily, or sometimes even weekly, you might drive yourself a little nuts. I have to be honest and say I’ve been worse about looking at analytics too frequently myself for my own account. They can also be a little volatile, which makes you feel confused. So all the more reason why it’s best to just look at a 30-day overview.
Now I do want to clarify, as I’m talking about looking at analytics and the frequency, this is all in relation to your organic strategy, NOT Pinterest ads. That would be another story for a different day!
Pinterest Analytics vs. Google Analytics
When I do my monthly reporting for my clients, I’m actually not just looking at Pinterest analytics, I’m also looking at Google Analytics. I report from both platforms because I really consider Google Analytics the gold star for accuracy.
In the past, Pinterest analytics had been historically inaccurate. Pinterest has made a lot of changes over the years and I definitely think the reporting within your Pinterest dash is more accurate. But, I still like to juxtapose it with Google Analytics.
In order to use Google Analytics, you will need to set that up and install it on your website, but it doesn’t take long and I actually do require that clients have it installed so I can report from both platforms.
Occasionally, Pinterest analytics will say that site traffic is up and Google Analytics will show that traffic is down, or vice versa, and in this case, I always default to Google Analytics in regards to what your traffic is REALLY doing.
An Overview of Pinterest Analytics
Whether you’re new to Pinterest, or you’ve been on the platform but know you haven’t been utilizing your data effectively, I want to share a quick overview of your Pinterest analytics. This will help you with understanding where to go and what you’re looking at on your dash!
Here’s where you go on your account to find your analytics:
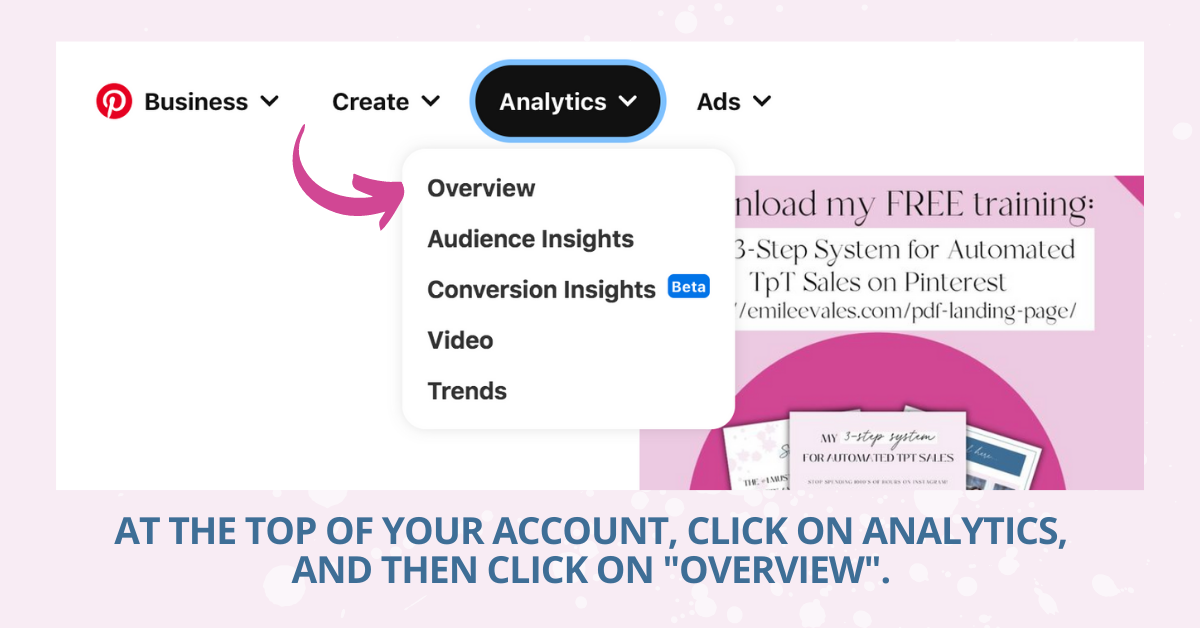
Once you’re inside your analytics you’ll see an overview, date range, and content type:
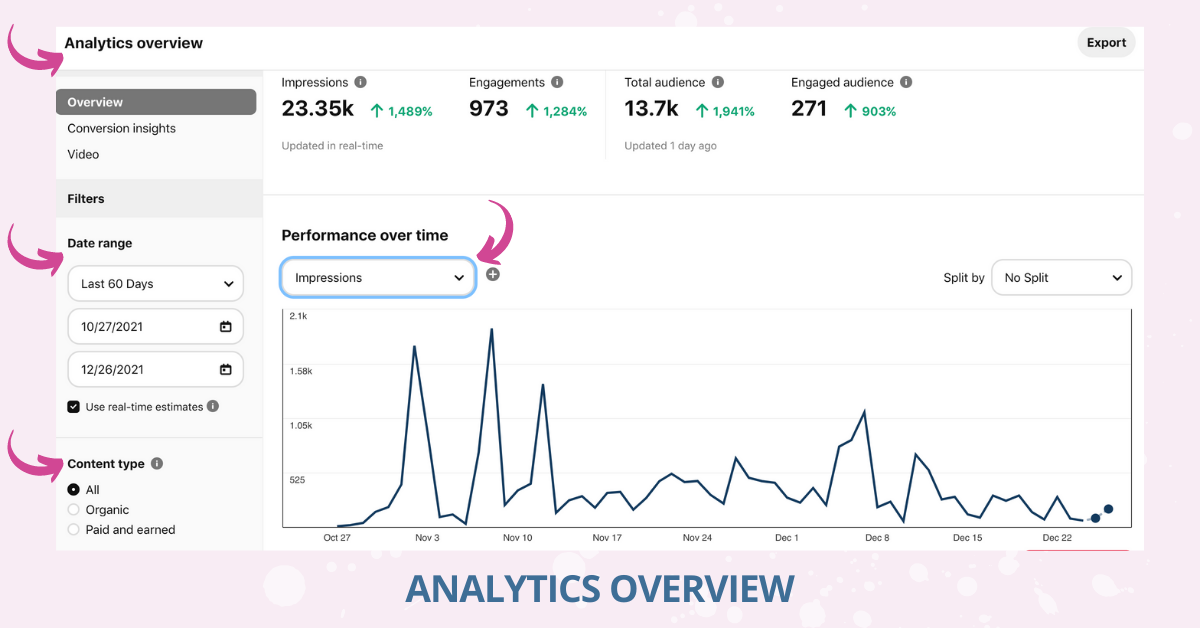
Then, you’ll leave it set on overview. Below you can apply various filters depending on if you want to look at the past 30 days, 60 days, 90 days, or a custom date range.
I want to note that Pinterest can only show you stats within the 6-month range. So if you try to look back further than that, it won’t happen.
With the limitations in regards to reporting on Pinterest, this is another reason why it’s important to have your Google Analytics set up and installed! You can see back as far back as the date that you installed your Google Analytics on your website.
Below the date range, you’ll see the content type. It will default to all, and then below you’ll see organic and paid/earned. You can leave it on all if you start running ads but you will see your metrics inflate. So if you want to separate the traffic sources, it can be beneficial to do so.
It’s not uncommon to see your traffic go down after turning off a paid ad, which is another reason why you might want to view these traffic sources separately.
In the middle where it says “performance over time”, you can filter what stats you are looking at within the graph. When you click that drop-down, it will give you a list of different options. What I look at within my account, and my clients’ accounts, are:
- Impressions– the number of times your Pin was on a screen
- Saves– how many times your Pins were saved (so people saving your Pins to their Pinterest boards)
- Outbound clicks– the total number of clicks to the outbound URL associated with that Pin
Understanding Pinterest Analytics
As far as what’s most important to me, I prioritize “outbound clicks” first. That’s actually telling us how many people are going to your site/store. The next priority is “saves”. It indicates that it was content that the Pinner found valuable and/or wanted to remember and be able to visit later. The least important metric I listed is the number of impressions. That’s because it shows no action or intent. It literally just means it was on someone’s screen. They could have just scrolled right past it and not even actually looked at it!
Impressions are what most Pinterest managers refer to as a “vanity metric” because it can feel good to have a high number of impressions.
But, if no one is visiting your site or saving your content, who cares about impressions?
I’ve found with my own account that my Idea Pins can inflate my monthly impressions. If you’re wanting to learn more about specifically tracking performance and understanding Idea Pins, I have an entire blog post about Idea Pins metrics that you can check out here. I devoted an entire blog post to them because they are unique since they aren’t linkable!
A metric that isn’t listed that I do report on for my clients is their followers. I do view your number of followers as an important number, and you can read more about that in this blog post.
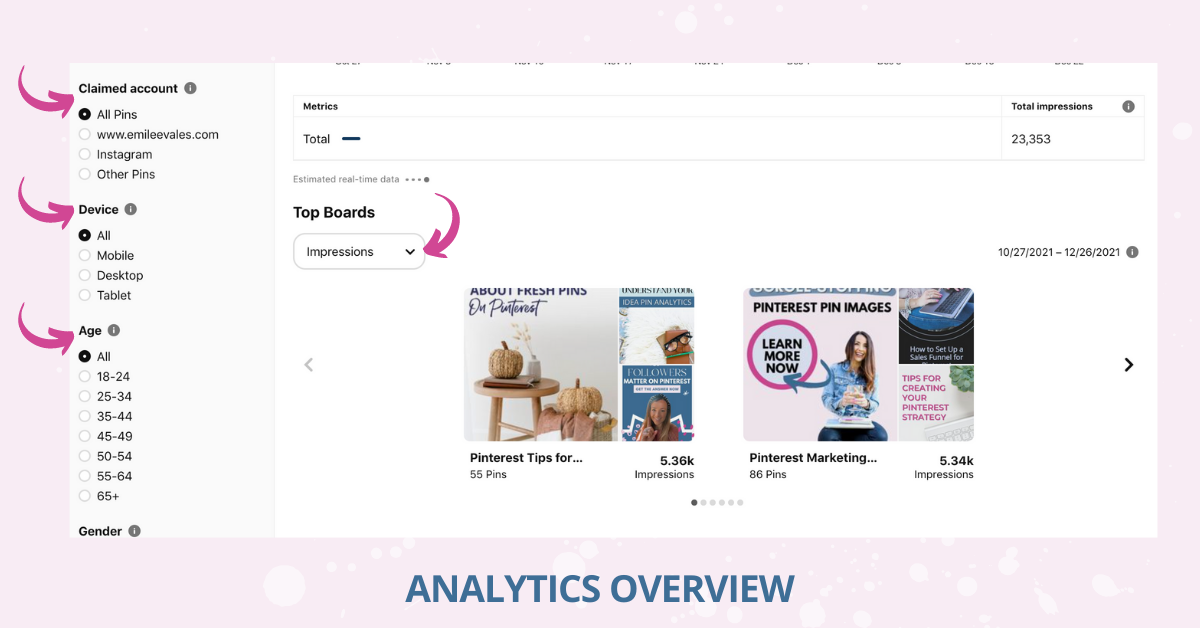
When you scroll below the section with the graph, you’ll see the next portion on the analytics overview page. On the left side, you’ll see where you can once again filter. This time you can filter by account, device, or age. Then to the right, you can look at the performance of your individual boards.
Under where it says “Top Boards”, you can decide which stats you’d like to view.
Helpful Tips
Perhaps you’re in the early stages of developing your Pinterest account. This means you might be Pinning more content from like-minded creators within your niche. Over time, I want to encourage you to move away from sharing others’ content. Focus on Pinning your own fresh content, or repinning older content strategically.
Once you’re Pinning consistently, it’s important to look at the traffic that’s from your confirmed domain. This can help you to see how much of what you’re viewing overall is actually to your website!
I do want to note, that if you’re sharing Pins that link to your YouTube, a landing page (maybe one created in ConvertKit or Flodesk) that’s not a URL for your confirmed domain.
It’s technically your content, but to see your analytics with these Pins taken into account, you’d need to look at your overall traffic.
Now let’s take a look at the last section on the analytics overview page!
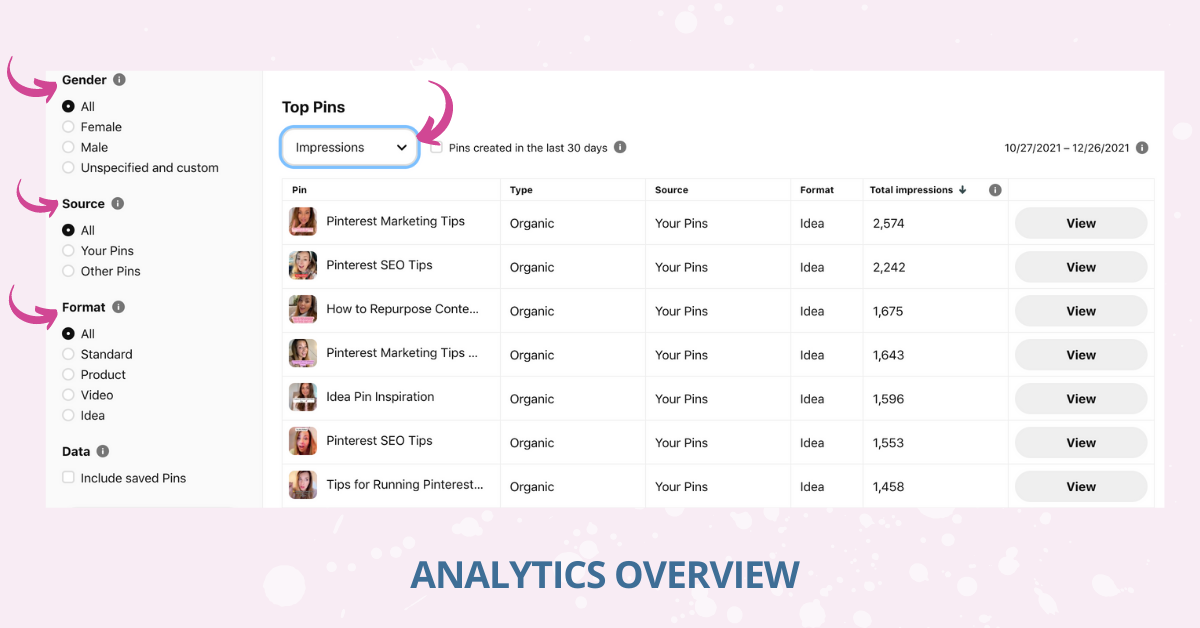
On the left-hand side of the page, you can once again add filters to what stats you’re viewing. You can filter by gender, source, and format. The source is the device that Pinners are using to look at your content. You can also filter by the type of Pin you want to look at. That would be under the “format”, so format represents the Pin format.
Under where it says “Top Pins”, you can decide which stats you’d like to view.
Final Thoughts
When you’re spending time and effort on a Pinterest marketing strategy for your business, you absolutely have to keep a pulse on your analytics.
Analytics will tell you if what you’re doing is “working”. It will also help you tweak and test what you’re doing on the platform.
As I always say, keep in mind that Pinterest is a search engine. It can take 6-12 months to see growth and results.
If you’re hiring a Pinterest manager, they should be giving you a detailed monthly report. For my clients, I use Google Sheets to organize their monthly analytics. This report doesn’t just give them the hard (and sometimes confusing) numbers. It’s an actual analysis of what they’re looking at numbers-wise and what it all means.
I would love to have been able to give you an overview of Google Analytics as well. But as you can see, Pinterest was more than enough to cover in one post!
To conclude, be sure to grab my FREE Pinterest strategy guide, and if you’re ready to go all-in with Pinterest, check out my signature course, Pinterest Marketing Magic!
")


")